


India is experiencing various forms of natural hazards including, earthquakes, landslides, floods, forest fires, cyclones, and drought etc. Among these, landslides are one of the more prominent and devastating natural hazards especially in the hilly areas of the country. The eastern part of Kerala state (Western Ghats) in southern India is highly prone to landslides due to its Physio‐climatic condition, especially the steep slopes and torrential rainfall that occur during the rainy season.
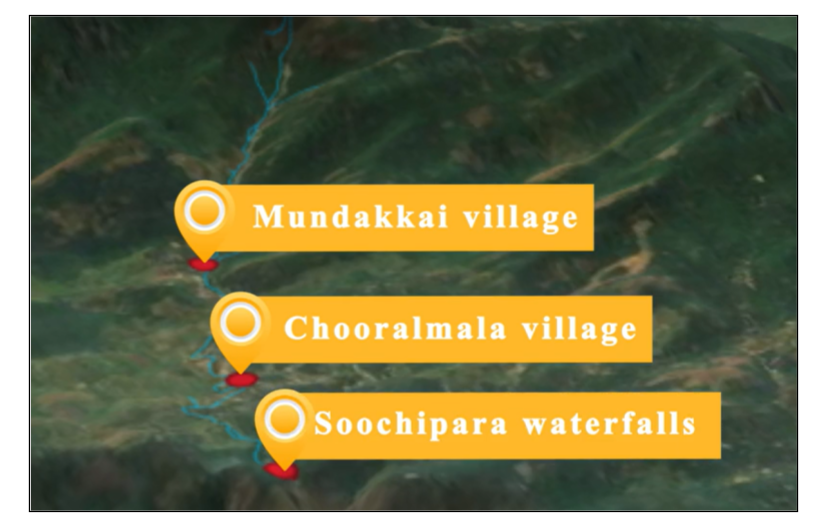
Figure 1
Wayanad district in Kerala was severely affected by a landslide on July 30, 2024, due to intense rainfall. The villages of the district, namely Mundakkai and Chooralmala were extensively affected (Fig.1), with approximately 392 people killed and many were injured in this tragic event. Such a significant loss of life highlights the need for planning and effective response strategies to lessen the impact of future disasters. Post-landslide investigations are crucial for evaluating casualties and assessing the extent of damage, enabling effective response planning and risk mitigation for future events.
Geographic Information System (GIS) and Remote Sensing are considered indispensable tools for efficiently and reliably assessing and mapping post-natural hazard damages and casualties. In this use case, the assessment of landslide damage in Wayanad was conducted using geospatial datasets. To conduct a comprehensive damage assessment, it is essential to gather detailed information about the amenities in the area prior to the landslide, along with data on the extent of the affected area. This information is vital for understanding the overall impact on the community and its infrastructure.
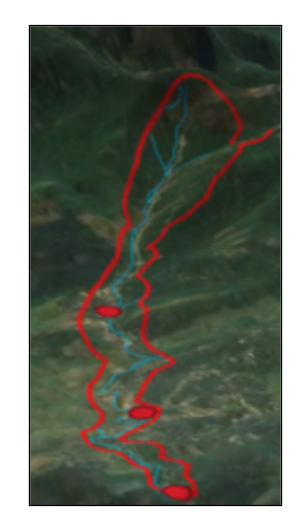
Figure 2
To determine the exact boundary of the landslide-affected area, Sentinel-1 pre- and post-event microwave imagery was analysed, as it helps to identify the temporal changes caused by the landslide and understand the extent of the affected area. Subsequently the extent of the flood affected area was delineated (Fig. 2).
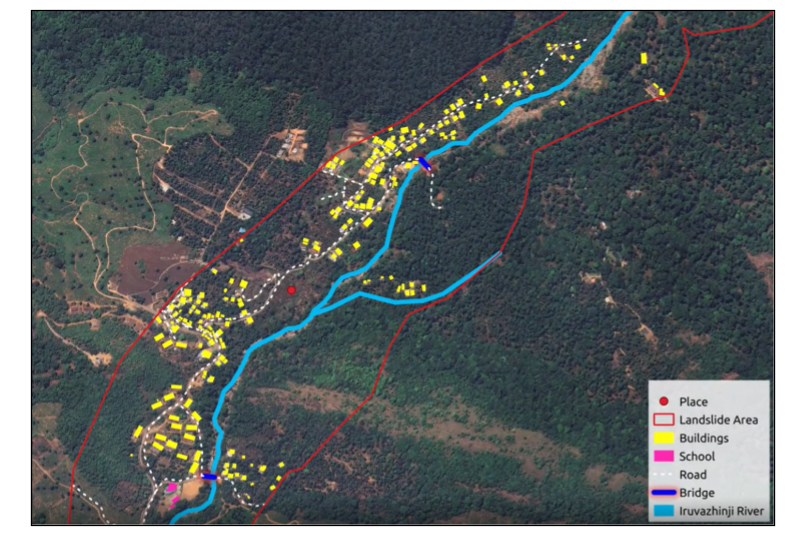
Figure 3a
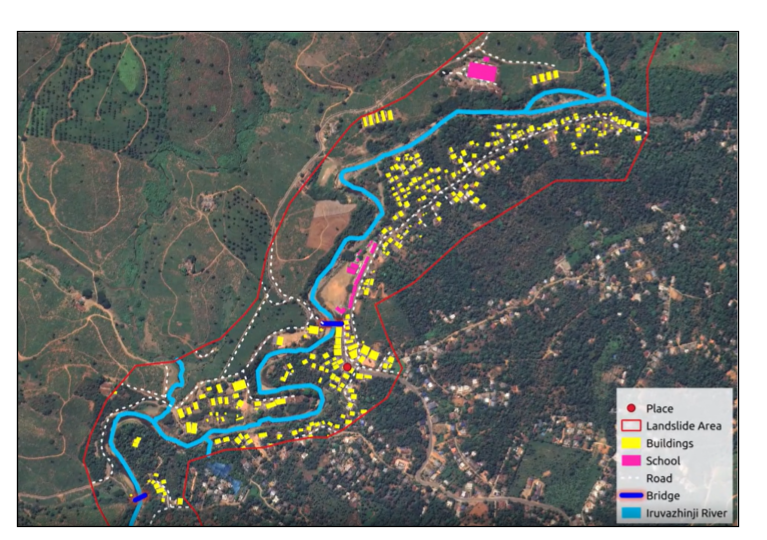
Figure 3b
To assess the damage caused by the landslide, detailed amenities data from OpenStreetMap (OSM)-including information on building footprints, schools, roads, bridges, etc. were utilised. The amenities data were then extracted to the landslide-affected boundary, as demarcated from the microwave data, to quantify the damage accurately. The findings show that the landslide caused extensive damage, affecting 507 buildings, 3 schools, and 4 bridges (totaling 112 metres), as well as 8.38 kilometres of roads (Fig. 3a-3b). This assessment shows the effects of the disaster and supports efforts to recover and restore affected communities and infrastructure . By employing these advanced technological tools and data sources, the assessment process can be significantly enhanced, leading to more informed decision-making and improved disaster management strategies in the future.
Related Posts


