


Urban sprawl around India’s coastline is a growing concern as the nation continues to urbanize rapidly. With an extensive coastline stretching approximately 7,500 kilometers1, encompassing the Bay of Bengal, the Indian Ocean, and the Arabian Sea, India’s coastal regions are home to numerous major cities and towns. This urban expansion is driven by economic opportunities, trade, and population growth, leading to the proliferation of residential, commercial, and industrial developments along the coast. However, this rapid sprawl poses significant challenges, including environmental degradation, loss of natural habitats, and increased vulnerability to climate change impacts such as sea-level rise and coastal flooding. As these coastal areas become more densely populated and developed, the need for sustainable urban planning and management becomes critical. Effective strategies must be implemented to balance development with environmental conservation, ensuring the resilience and livability of coastal cities in the face of future challenges. Optimal resource allocation and the expansion of infrastructure are essential to alleviate stress on natural resources and cater to the growing requirements for coastal infrastructure like roads, ports, and housing. Disaster risk management in these regions, prone to natural disasters like tsunamis and cyclones, relies on studying urban sprawl to identify high-risk areas and implement preparedness measures. Furthermore, managing ecotourism activities in biodiversity-rich coastal areas requires understanding urban sprawl patterns to minimize environmental impacts and maximize economic benefits. Lastly, coastal erosion management involves designing effective erosion control measures, assessing hydrological impacts of land use changes, and identifying vulnerable areas to mitigate erosion risks.
One of the ways to study these urban sprawls along the coastline is by using satellite-based imagery. ML techniques such as image processing algorithms can be used to clean, enhance and process satellite imagery which often requires preprocessing before analysis. The World Settlement Footprint2 is a 10m resolution binary mask outlining the human settlements globally derived by means of 2019 multitemporal Sentinel-1 and Sentinel-2 imagery. The Survey of India is the national survey and mapping agency of India which has datasets pertaining to the coastlines, not only in the mainland but also along the several hundred islands which our country has that are available as a public resource.
The Unified Geospatial Interface eXchange provides application developers with analytical ready data to allow them to rapidly develop an application in a standardized and secure manner. UGI is the manifestation of the National Geospatial Policy 2022 which makes geospatial datasets more accessible and actionable for the stakeholders to make informed decisions.
Thazhal Geospatial Analytics, a start up company that monitors assets from space to assess climate risks and provide geospatial solutions, working closely with the UGI team at CDPG, FSID, IISc has been developing a web application based on these coastline datasets to analyze and understand coastal urban expansion trends, identify driving factors, assess impacts, and inform policy and planning decision makers for sustainable coastal management. By forecasting urban growth, cities can implement land-use plans that balance residential, commercial, and industrial areas. This helps create well-designed urban landscapes that meet the needs of the growing population. Datasets from UGI, including coastline data, were used to develop this application.
By using this developed application, a user can:
- Visualize the coastal boundary of the mainland, and analyze urban sprawl since 1985 for every 3 years and,
- See multiple year wise images as a timeseries.
The web application has features like panning, zoom in, zoom out, full extent, and etc,.
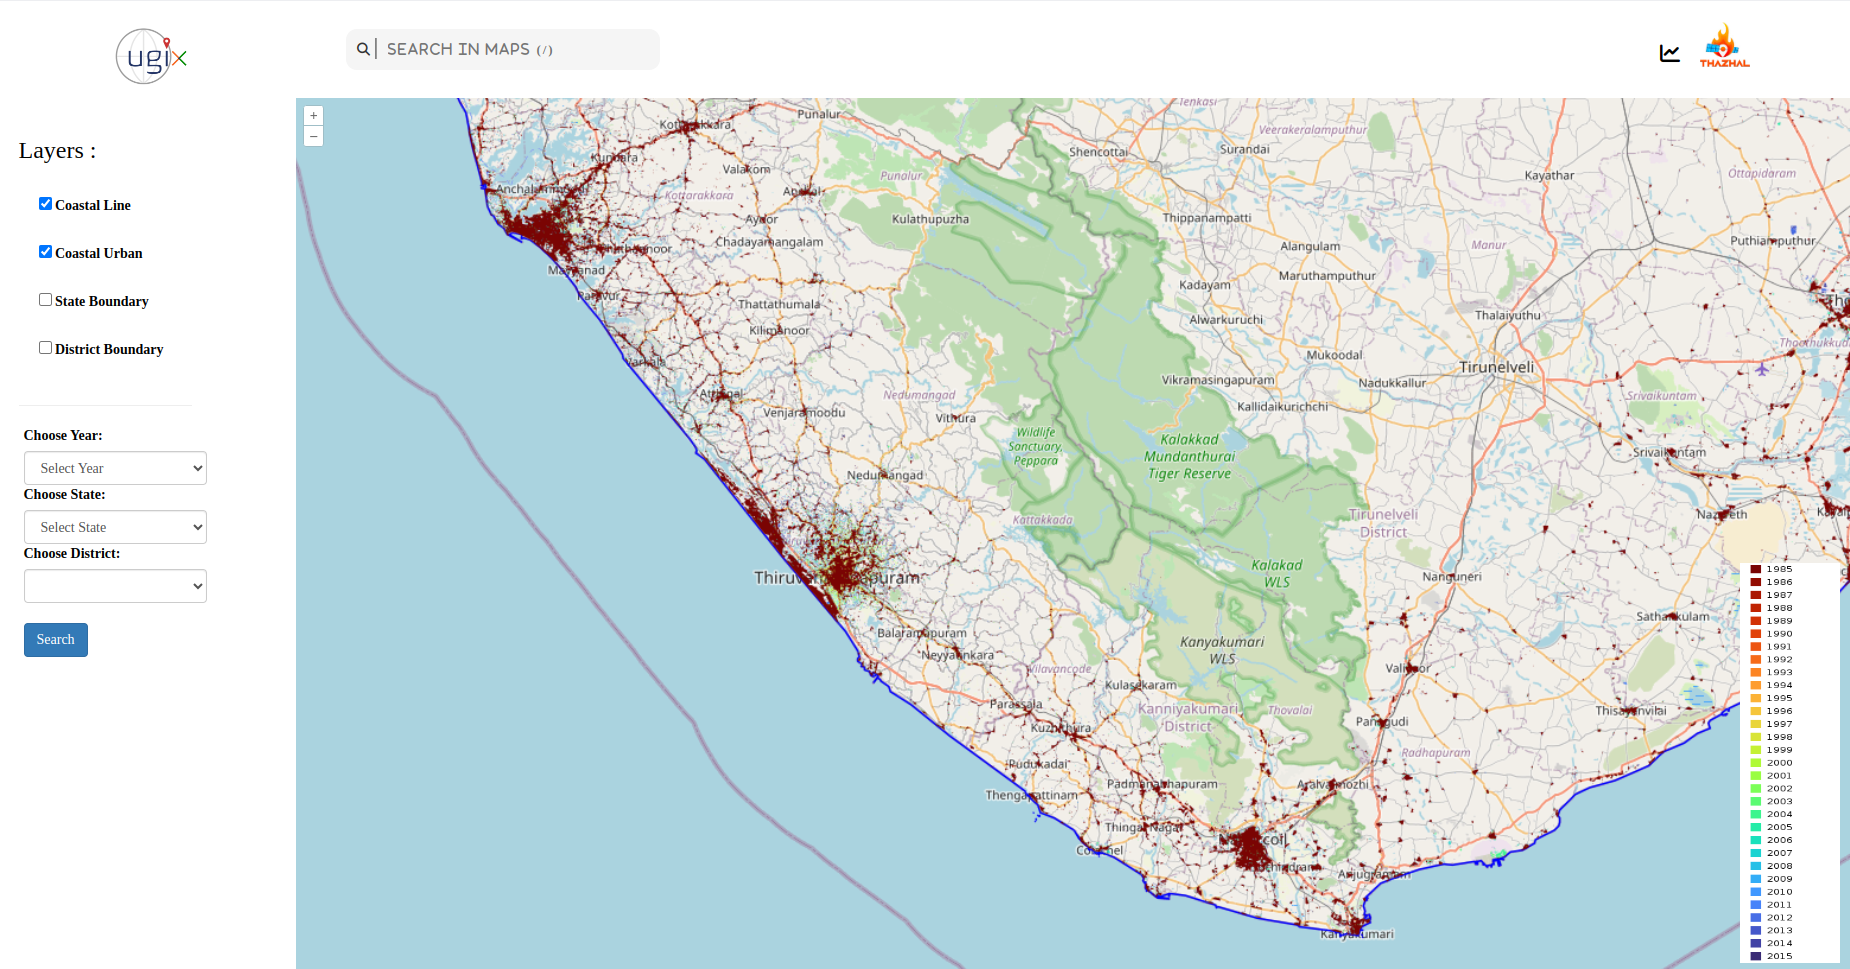
Fig1: This figure illustrates visualization of urban sprawl along the coastlines. The blue line represents Survey of India (SOI) coastline datasets onboarded to UGI platform. The brown data represents aggregated urban sprawl from 1985 to 2015
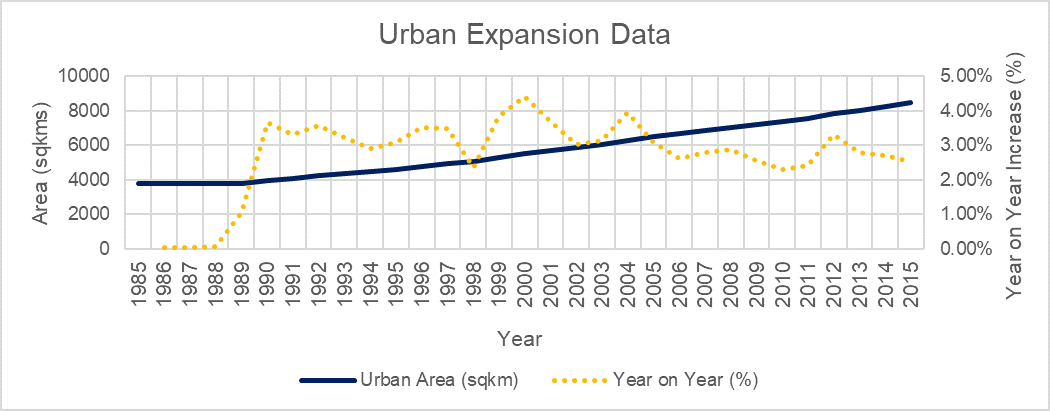
Fig 2: This figure illustrates the increase in urban sprawl over the last 30 years (from 1985 to 2015). The blue indicates urban sprawl cover in sq kms.and orange indicates theYear on Year % increase
The application has given some insights and it has been observed that
- Over the last 30 years (1985-2015), there has been a significant increase in urban sprawl of approximately 124.74%
- Across the States / UT, it has been observed that minimum sprawl happened in Daman and Diu at about 27 sq kms, and maximum urban sprawl happened in Kerala covering 1,855 sq kms
- It shows Year on Year percentage increase in urban sprawl.
Based on these above listed and other insights, interesting observations regarding the mapping of these data with economic growth of a particular state, return of investment on coastal tourism and biodiversity could be computed and effective planning could be implemented.
References
Related Posts


