Land Use Land Cover (LULC) classification is a vital process in remote sensing and geographic information systems. It categorizes Earth’s surface based on physical cover (e.g., forests, water, buildings) and human usage (e.g., agriculture, urban development, conservation). For instance, an area may have a land cover of ‘grass’ with a land use of ‘park’ or ‘golf course’. This classification, typically performed using satellite or aerial imagery, helps us understand and manage our changing planet. By employing methodologies like neural networks or decision trees, segmented regions are classified based on characteristics such as color, texture, and shape. This provides crucial insights for urban planning, environmental monitoring, and resource management. Our approach uses semi-supervised learning, leveraging both a large pool of unlabeled images and a small amount of labeled data. Using Convolutional Neural Networks (CNNs), this method enhances classification accuracy by effectively learning from the available data.
DATA COLLECTION
In LULC classification, two main types of data are used: Raster data and Vector data.
Raster Data Acquisition – Raster data consists of a matrix of cells (pixels), each representing a value of information, typically reflected light or electromagnetic radiation. It’s like a digital photograph composed of a grid of pixels where each pixel represents a specific area on the Earth’s surface and the size of the area each pixel represents is called the spatial resolution.
Cartosat-3 Multispectral (MX) imagery – This high-resolution satellite imagery from an Indian satellite captures data at multiple wavelengths, including visible light and near-infrared. With a spatial resolution of 0.75 m, each pixel represents a 0.75 m x 0.75 m area, enabling detailed urban analysis. The data, acquired from the NRSC (National Remote Sensing Centre) portal, hosts a huge catalog of data products from ISRO and various Indian Missions.
Vector Data Acquisition – Vector data represents geographic features as points, lines, or polygons. It’s used to precisely define the boundaries of features like buildings, roads, and water bodies.
JOSM (Java OpenStreetMap Editor)
Training Data
OpenStreetMap is a collaborative project to create a free, editable map of the world. The data from OpenStreetMap was used to train the machine learning models.
Microsoft Buildings – Validation Data
Microsoft Buildings is an AI-generated dataset of building footprints created by Microsoft. Predictions of this model was used to Validate our model
Google Buildings – Validation Data
Google using its AI algorithms also has its own dataset of building footprints and this was also used for validation.
Using both Microsoft and Google data for validation provides a more robust check on the model’s accuracy.
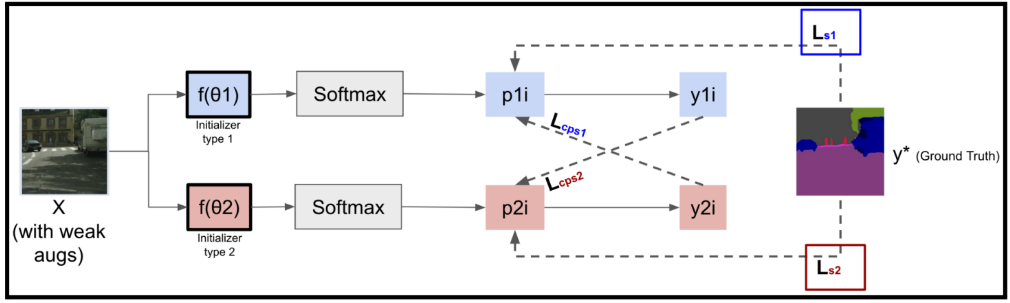
The CPS approach employs two cutting-edge DeepLab v3+ models to elevate the precision of land use classification in satellite imagery. This sophisticated architecture is renowned for its excellence in semantic segmentation tasks. Consequently, the system becomes adept at segmenting and classifying diverse and challenging landscapes, providing a formidable tool for environmental monitoring, urban planning, and resource management.
Figure 1. Cross Pseudo Supervision Semantic Segmentation
Figure 1: An example secure multiparty computation with four parties computing a common function F using their respective private data (A, B, C, D). Each party generates and sends shares of its private data to the other parties. The received shares are utilised locally to compute a function, G. The local outputs can subsequently be used to reconstruct the final answer, i.e., F(A, B, C, D).
APPLICATIONS
Urban Planning and Development
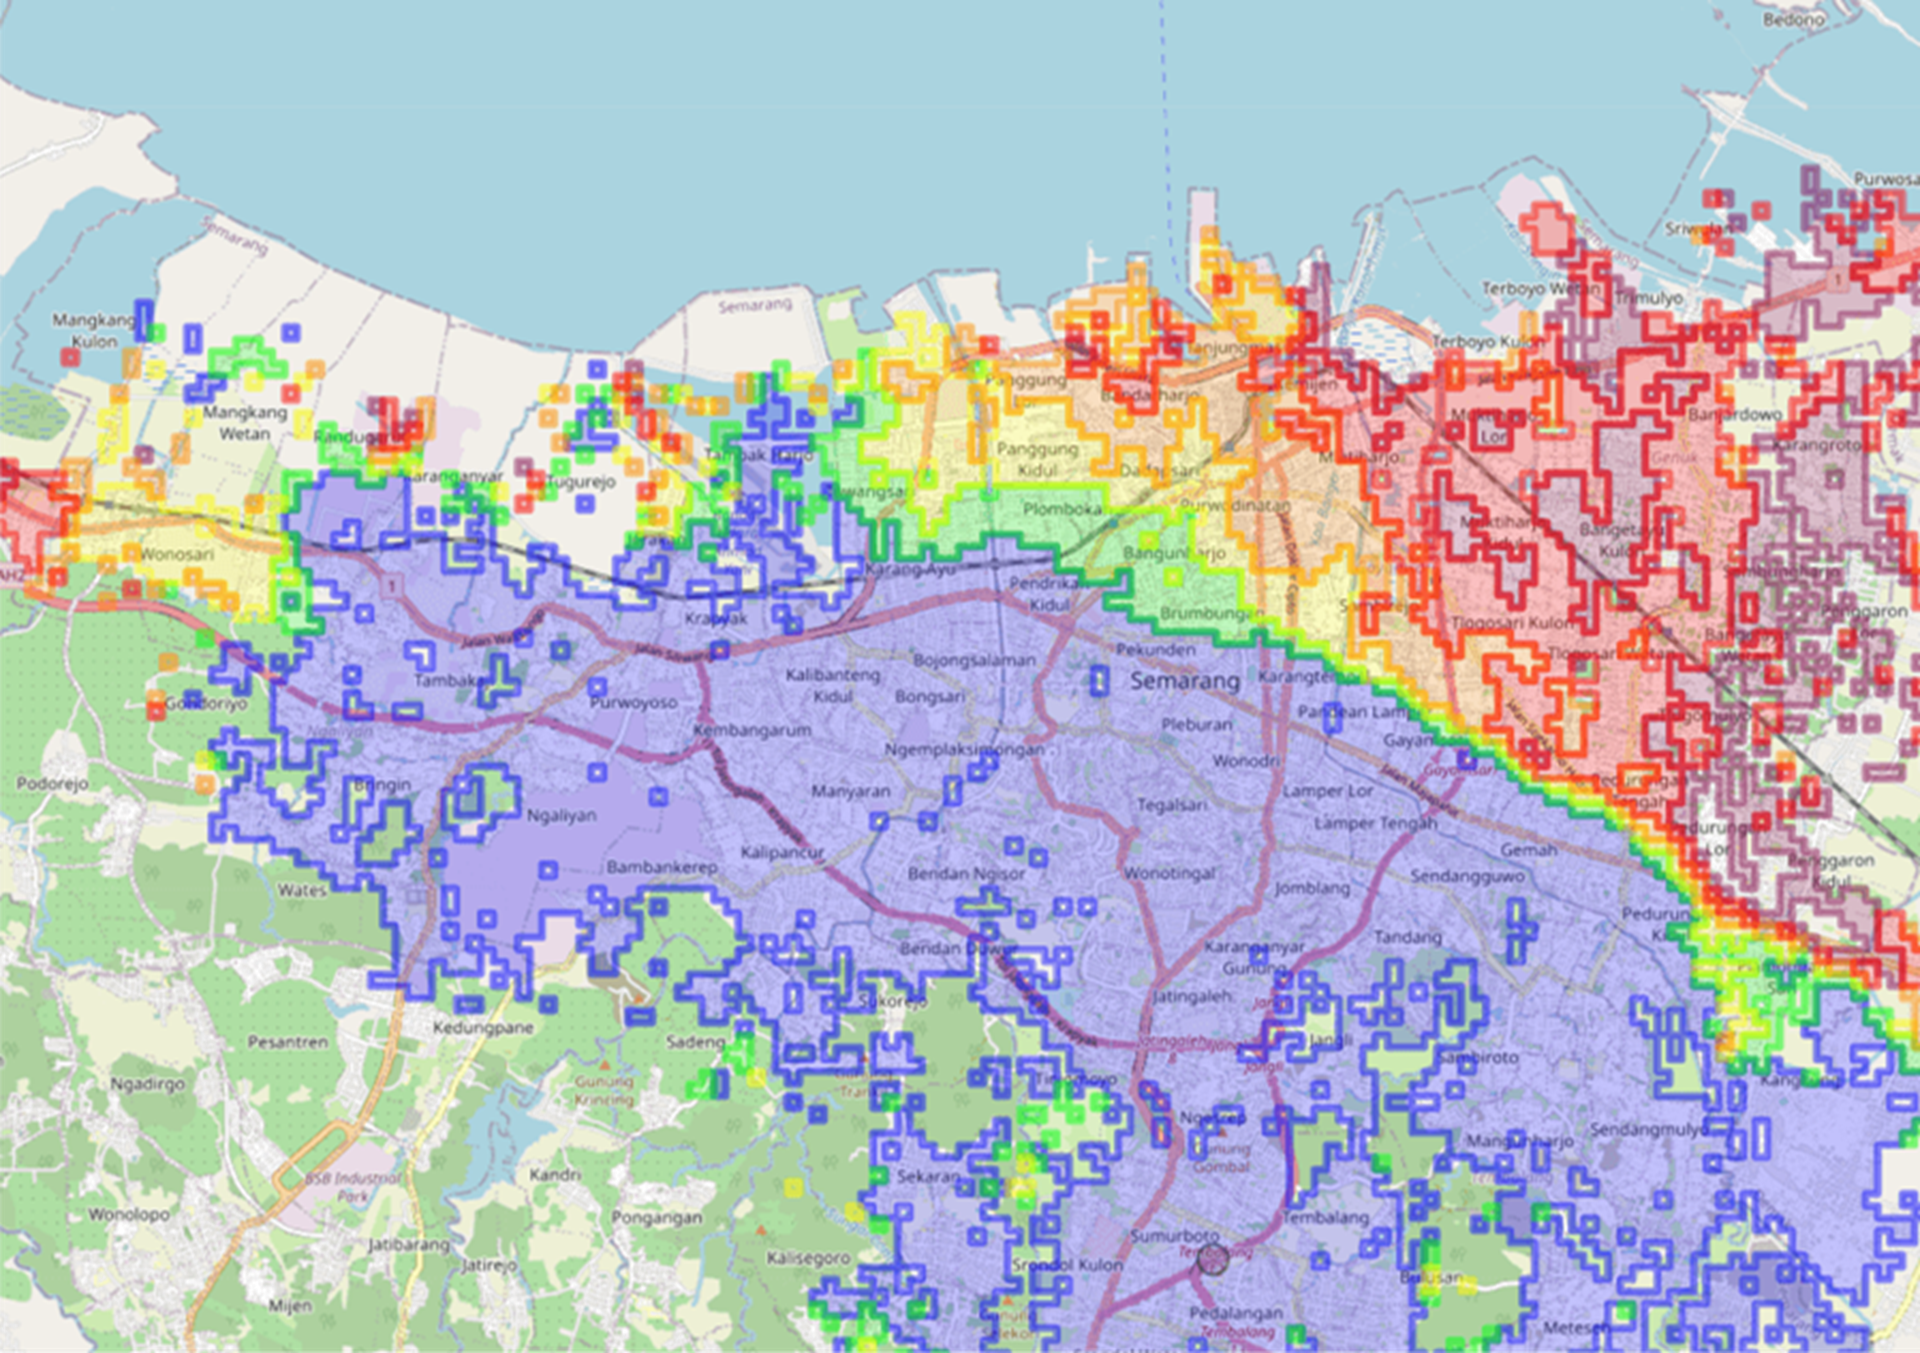
LULC data is vital for city planning and development, identifying areas for residential, commercial, and industrial use, and ensuring sustainable land management. It’s crucial for infrastructure planning, including roads and public utilities.
Figure 2. Property Boundary Detection
Agriculture and Land Management
Farmers and land managers use LULC data to optimize crop planning, irrigation systems, and soil conservation practices. It helps in identifying arable lands and understanding the patterns of land use changes that affect agricultural productivity.
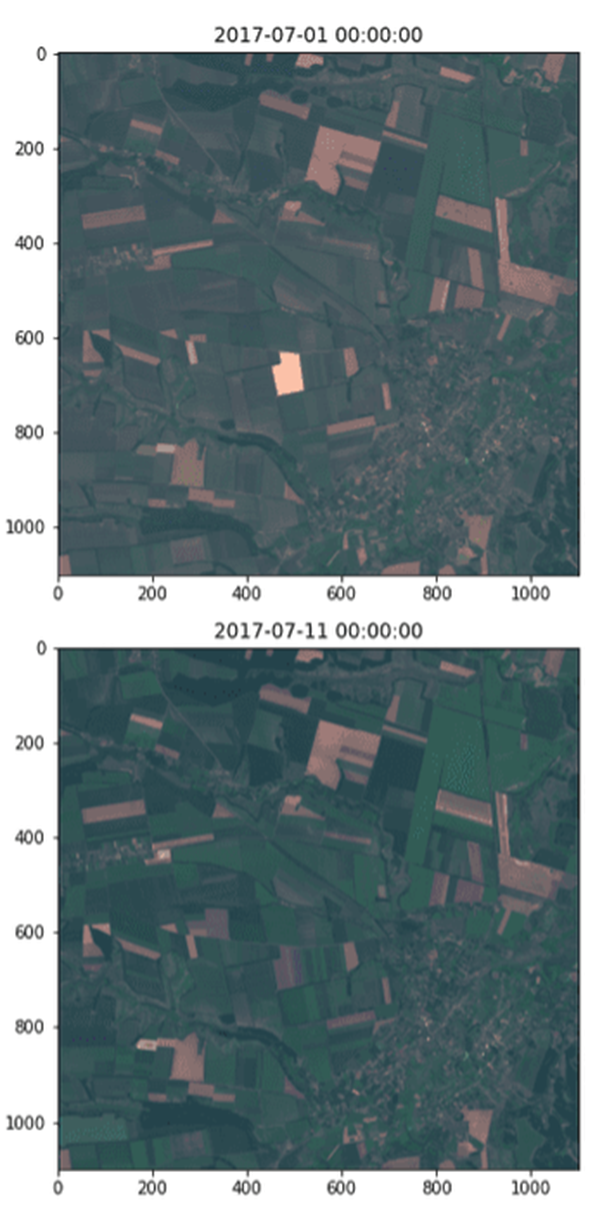
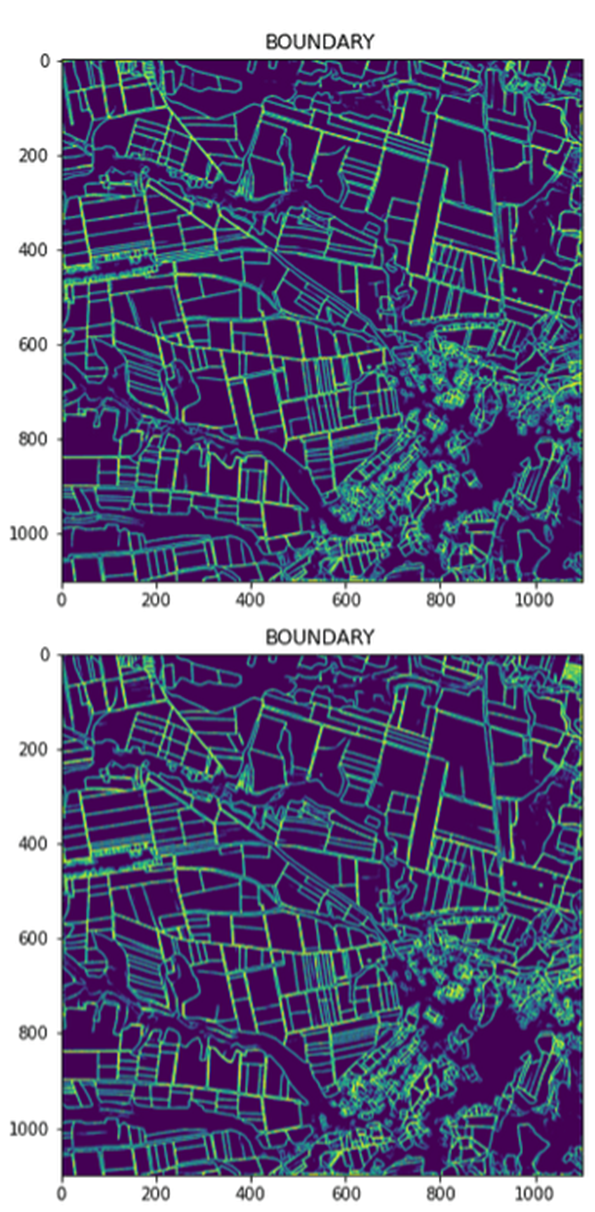
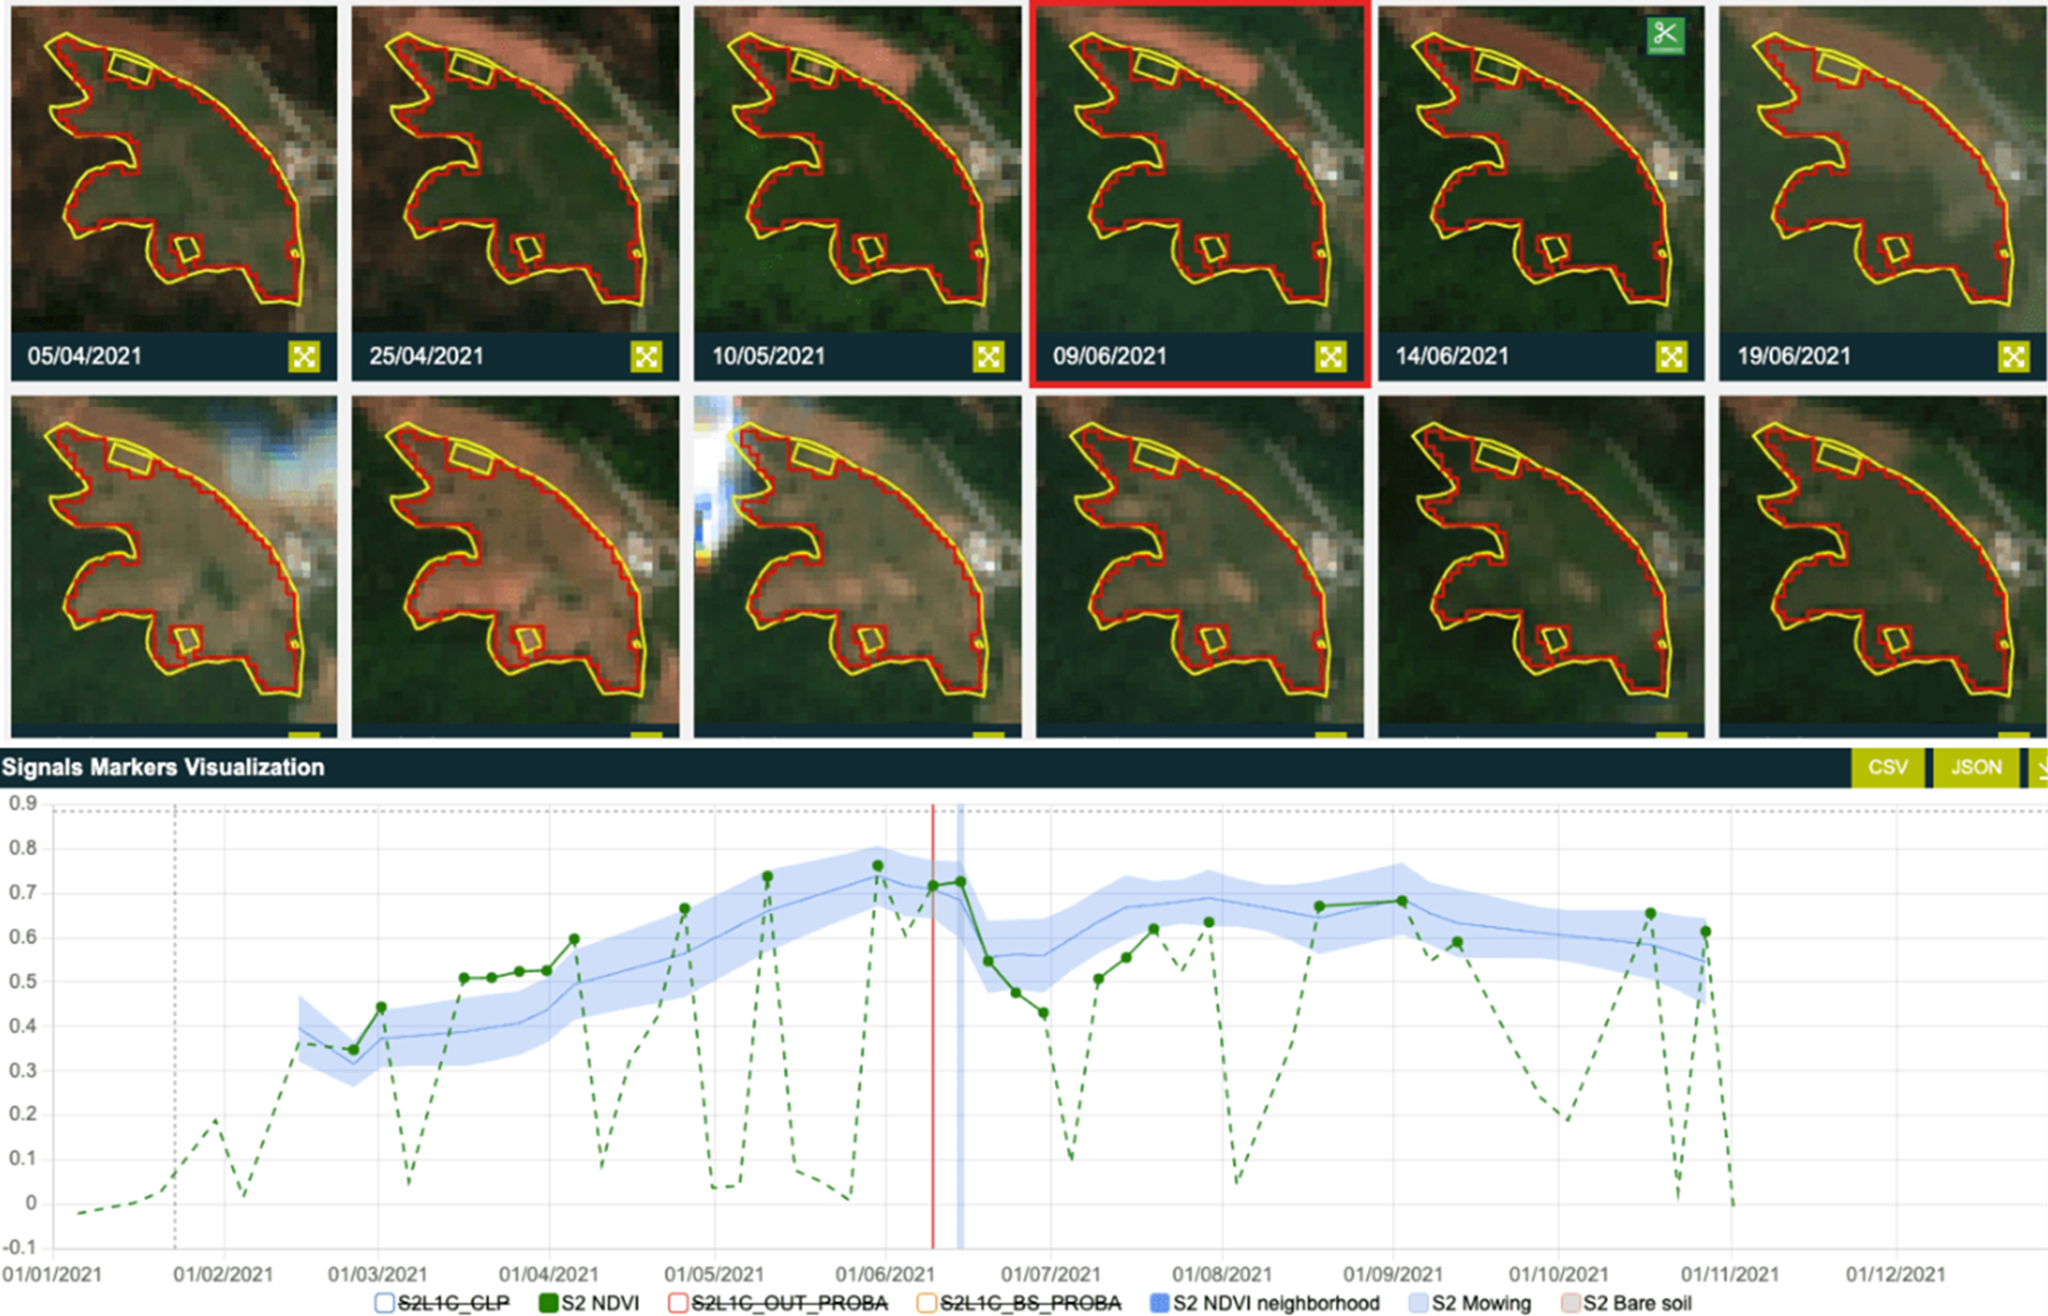
Figure 3. Land Crop Rotation Pattern Analysis
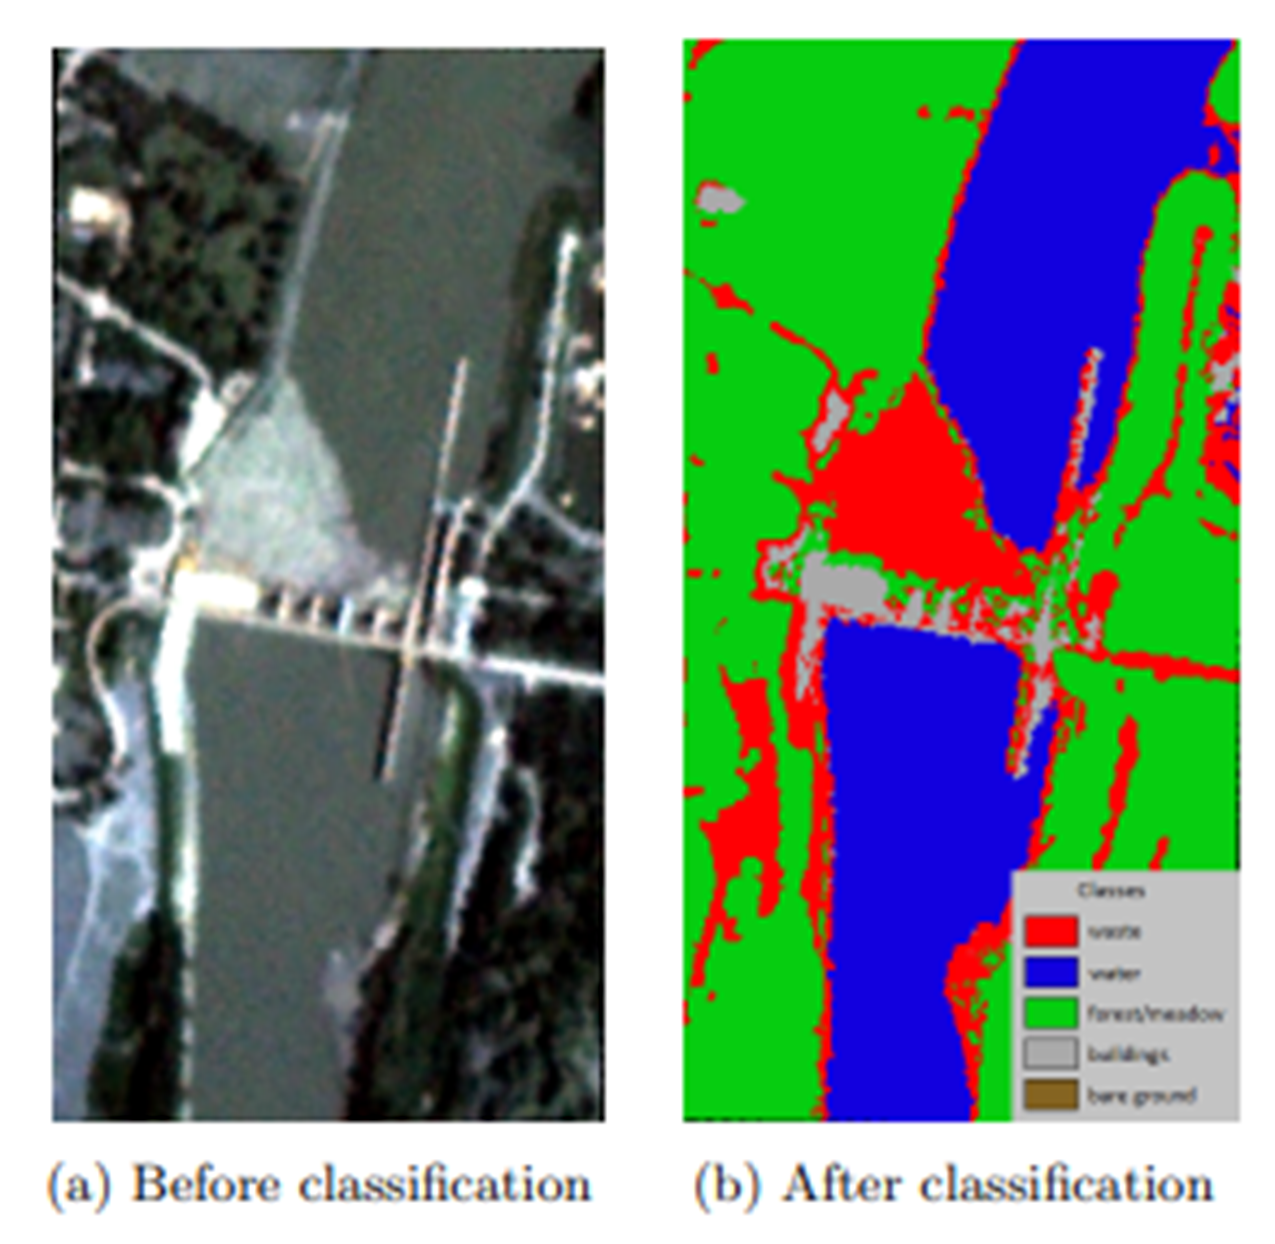
Environment and Natural Resource Monitoring
LULC classification helps monitor natural habitat, forest cover, wetlands, and ecosystems, crucial for conservation and biodiversity.
Policy Making and Governance — Policymakers use LULC data for making informed decisions on land use, zoning, and environmental laws, balancing development with conservation.
Figure 4. Green Cover Analysis
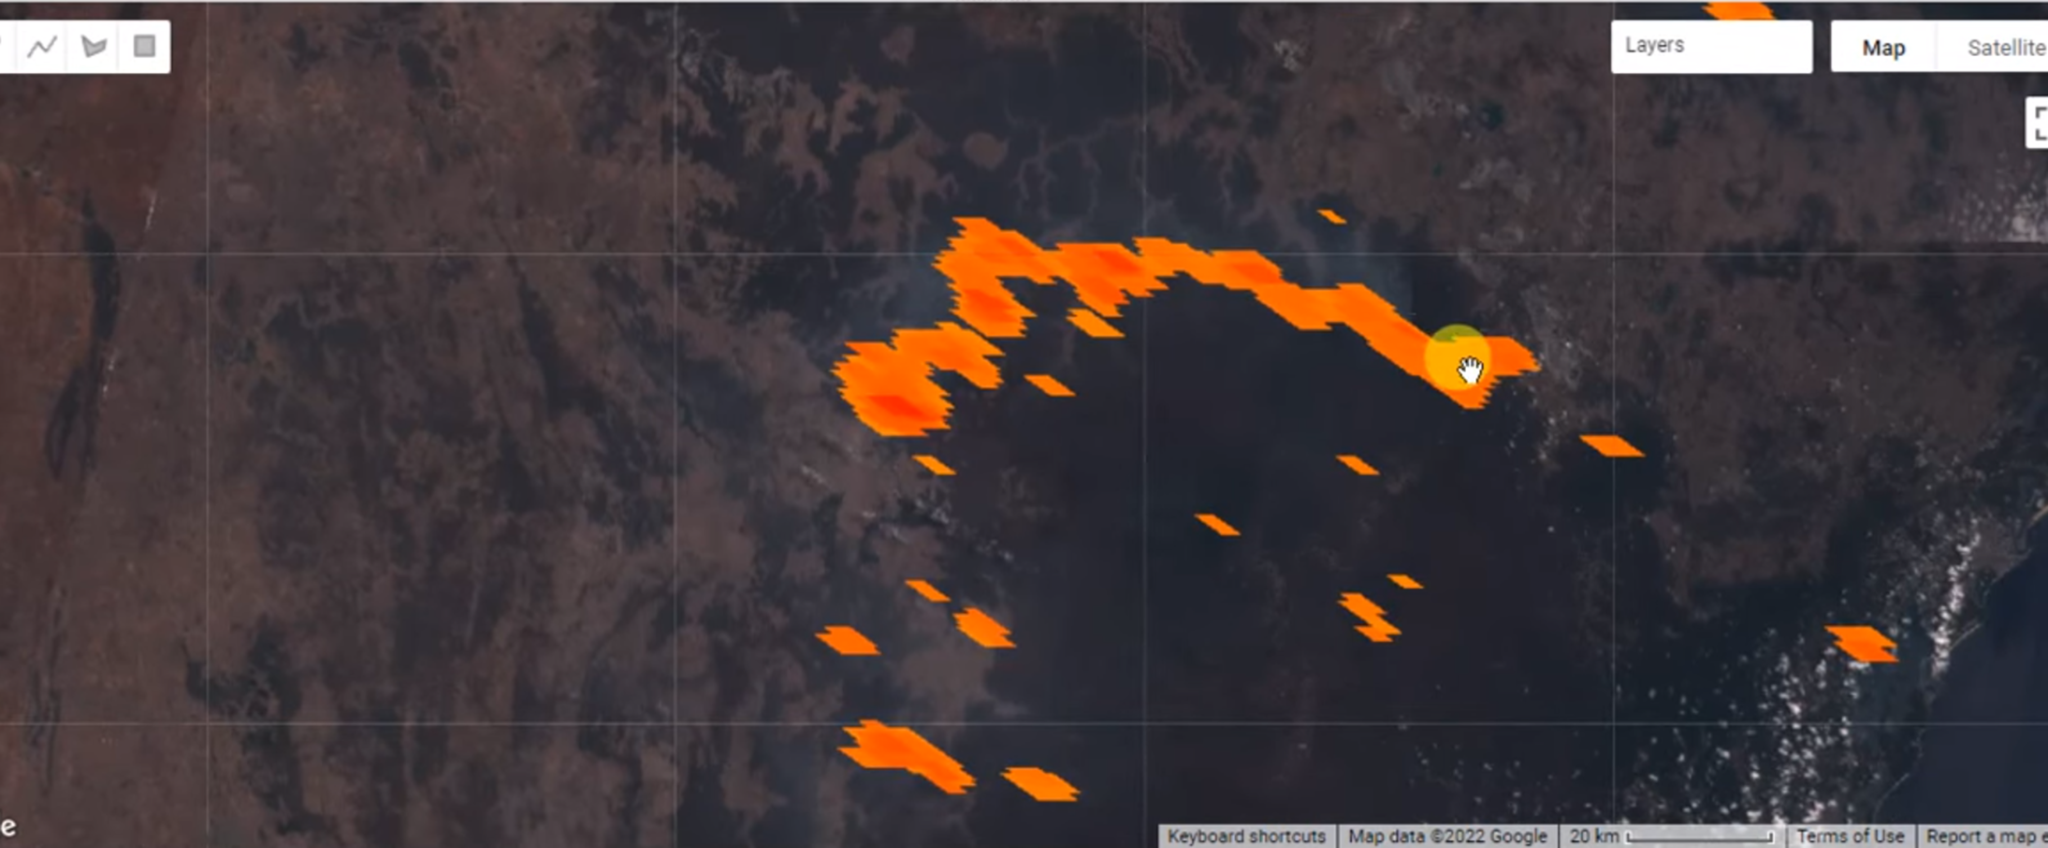
Climate Change Studies
LULC data is integral to climate change research. Changes in land cover, like deforestation or urbanization, impact the Earth’s climate system. Understanding these changes helps in modeling future climate scenarios and developing mitigation strategies.
Figure 5. Forest Fire/ Stubble Burning Detection
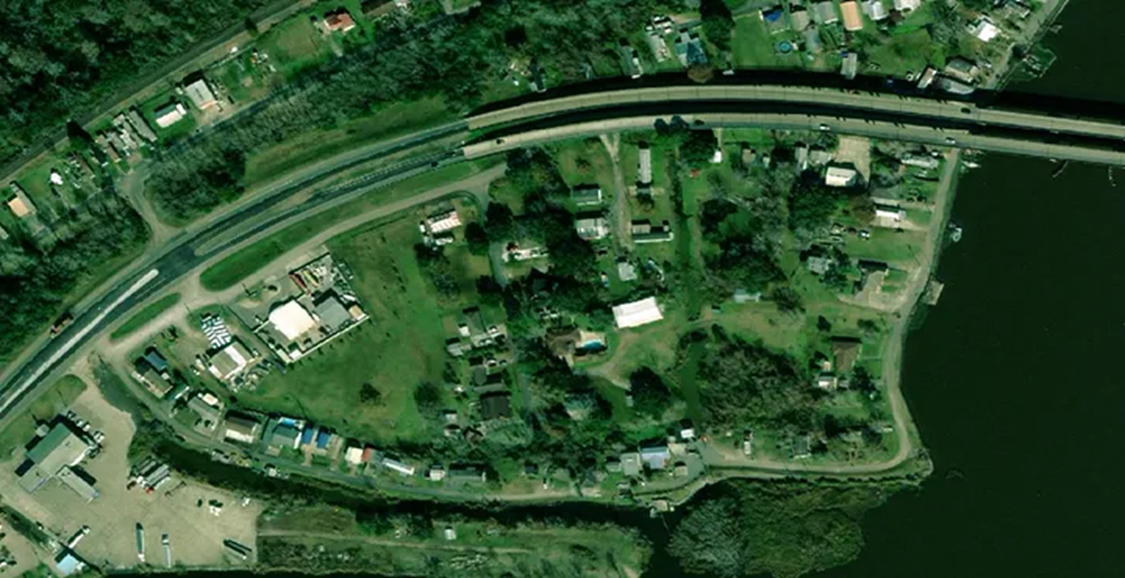
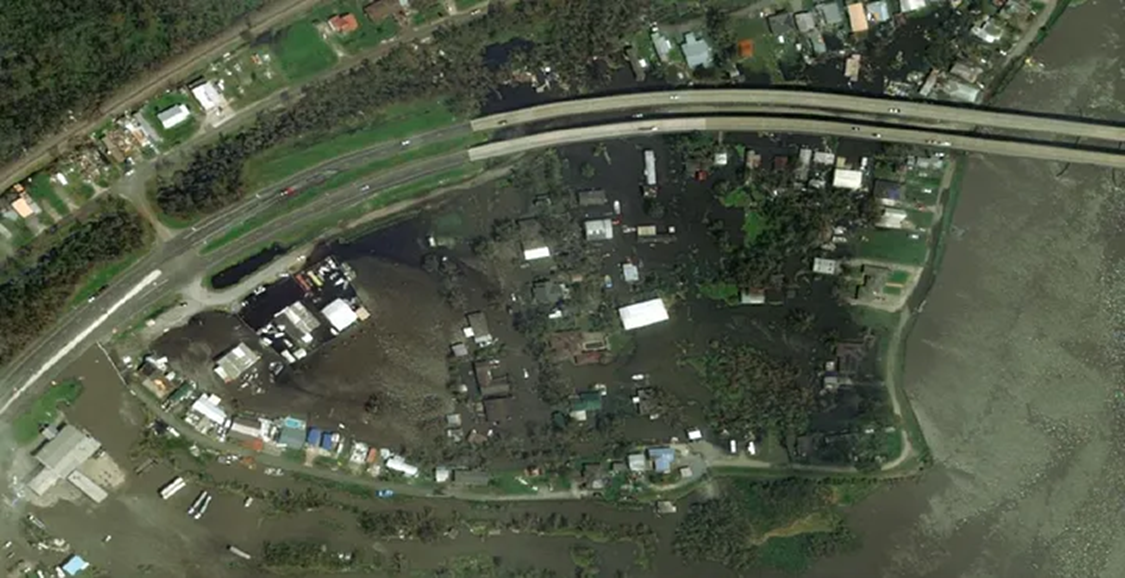
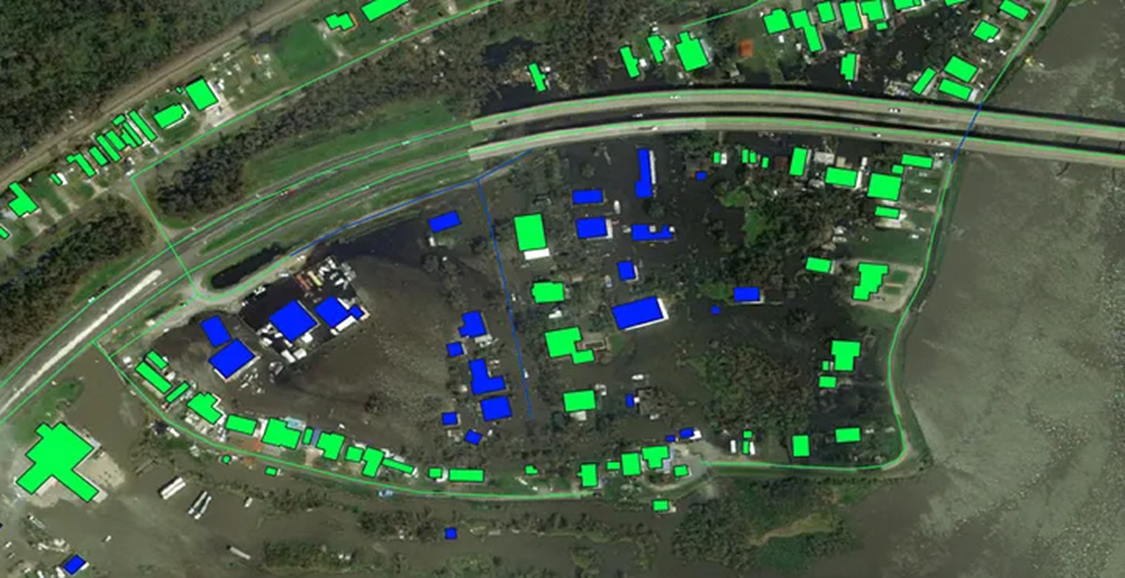
Disaster Management and Response
LULC classification provides valuable information for disaster management. It helps in assessing risk and vulnerability to natural disasters like floods, landslides, and forest fires, thereby aiding in emergency planning and response.
Before Flood After Flood Figure 6. Buildings affected by Flood Detection Analysis after segmentation
Water Resources Management
LULC data assists in water resource planning and management. It helps in understanding watershed characteristics and their changes over time, which is vital for managing water supply, quality, and flood control.
Figure 7. Froth or Foam Detection in Water Bodies
FUTURE WORK
Expand CartoSAT-3 Imagery Acquisition: Procure additional CartoSAT-3 satellite imagery from the NRSC, encompassing various cities and geographical regions. This expanded dataset will enable the models to adapt and perform more effectively across different vegetation types, urban landscapes, and more.
Broaden Label Diversity : Obtain a more comprehensive set of labels covering a wider array of classification categories. This includes distinguishing between different types of farmlands and vegetation, as well as differentiating between various building types, such as residential and commercial. This enriched labeling will further refine the models’ accuracy and applicability.
Smart City Living Lab, A Case Study – For Sensors & Standards for Smart city Solutions
Anuradha Vattem
Lead Architect, Smart City Living Lab, IIITH
Manpreet Singh
Chief Program Officer, National Urban Digital Mission
Dr. Manjula Das
Deputy Director & Chief of Operations, CPDTRI Laboratory Director, ADRC PI, Molecular Immunology, Mazumdar Shaw Medical Foundation (MSMF) Director, Beyond Antibody LLP
Data Designs Diagnostics and Drugs
Till the late 20th century healthcare has been the forte of biology evading the clutches of mathematics. The new millennium digitised life and sciences therein leading to data-explosion. How digitization and data is propelling healthcare for public good will be discussed with specific examples from the world of diagnostics and therapeutics.
Dr. Himanshu Chauhan
TBD
Dr. Prashant Mathur
Director, ICMR-NCDIR
India’s Data Privacy and Security Roadmap
Tulika Pandey
Senior Director, MeitY
Session Chair
Prof. Debnath Pal
Professor, Indian Institute of Science, Co-founder ReneLife, Research Consultant
DPDP Act and its Impact on Healthcare
The Digital Personal Data Protection (DPDP) Act 2023 creates a legal framework for the secured use of personal digital data to eliminate abuse. However, the Act’s provisions appear to have been drafted primarily with the e-commerce websites, personal data-based applications, and other digital customers in mind, not the healthcare community. Healthcare in the digital era requires communicating sensitive patient information over the web with clinicians for responsive advice and consultation. The consequences of such data-sharing involving medical personnel are not clear. Besides, the growth of digital health technologies requires patient data to be accessible anonymously and in de-identified form. Elimination of personal information alone does not guarantee de-identification. Also, to what specific detail one must describe the intended use of data for research and technology development is not articulated. Thus, the gray areas in the Act pose a challenge for the Indian medical ecosystem, which could incur penalties under the DPDP Act 2023.
Sunita Nadhamuni
Chairperson, Arghyam
Implementing a Data-centric Public Health Technology System
This topic covers the development of a data-centric public health technology system, with insights from the NCD Portal for the National Non-communicable diseases program. The NCD Portal is used in 31 states and has more than 45 million people on treatment for hypertension and diabetes.
It explores the role of data in four key phases of the technology system: design, platform development, operations, and field adoption. In the design phase, data-driven insights, such as search patterns of frontline workers and medical officers optimize the user interface for speed and efficiency.
Platform development focuses on secure management and rule-based access control of data coming through APIs and data streams, transformed and cleaned, and going to the data warehouse for reporting needs.
Daily operations leverage Application Performance Monitoring (APM) tools and telemetry to identify and resolve performance issues proactively. Field adoption is enhanced through data analytics, guiding weekly reports for program review and feedback loops to prioritize feature development.
Embedding data-centricity throughout the system lifecycle supports large-scale, efficient and secure public health service delivery.
Rama Devi Lanka
Director, Govt of Telangana, Emerging Technologies, Tech for Social Good
Panel Chair
Dr. Prabhdeep Kaur
Chair & Professor, Isaac Centre for Public Health, IISc
Roli Agarwal
Head, Product Partnerships, Google
Viksit Bharat | Tech for Circular Economy – National Masterplan
Abhijeet Sinha
National Program Director, Ease of Doing Business, Project Director, NHEV, President, CPOs of India, & Ex-CAG Member
Session Chair
Aurindam Bhattacharya
Scientist G, Centre for Development of Telematics
Session Chair
Prof. Anjula Gurtoo
Chairperson, Centre for Society and Policy, IISc
Naresh Soni
CEO, DeepMatrix
Geospatial Data Democracy: A Technical Perspective
In this talk, titled “Geospatial Data Democracy: A Technical Perspective,” we will explore how advancements in technology can enable broader access to geospatial data for public good. From open data platforms to cutting-edge tools that lower barriers for non-experts, this session will dive into the technical innovations that have potential to democratizing geospatial information. We will also address the challenges of data privacy, standardization, and infrastructure, and discuss how these obstacles can be overcome. By giving some real-world case studies and future directions, this talk will provide a comprehensive technical outlook on how geospatial data can empower communities, enhance public services, and foster transparent governance.
Nikhil Kumar
President, Geospatial Business at MapmyIndia
Geospatial Data: Policy, Infrastructure and Adoption
We see a growing need for geospatial data & solutions for situational awareness, informed decision-making and smart governance. The geo continuum of Capture, Create, Model, Visualize, Analyze and Share involve diverse frameworks and workflows driving variety of applications for Public good. Liberalization of Geospatial sector coupled with a series of Impactful Initiatives triggered the growth & adoption of geospatial data accelerating the country’s digital transformation journey.
The Challenges and Benefits of Geospatial Data
Hitesh Kumar Makwana
Surveyor General of India, Govt of India
The Power of Data Driven Agriculture
Jayesh Ranjan
IAS, Special Chief Secretary, Department of ITE&C & Department of Industries & Commerce, Govt of Telangana
Lt Col V S Velan
CTO, Elena Geo Systems Pvt Ltd
Sasikumar Ganesan
Head of Engineering, Modular Open Source Identity Platform (MOSIP)
Building practical security and privacy in large-scale DPI
The quad of Awareness, Law, Policy, and Technology. In securing and safeguarding privacy on a grand scale, we encounter an interplay of four pivotal elements: Awareness, Law, Policy, and Technology. This quadrivium represents not merely a technical or administrative framework but a philosophical foundation that shapes our approach to managing and protecting information in an increasingly complex digital world.
India’s Different Approach to Data Economy – It’s Merits and Challenges
Sharad Sharma
Co-Founder, iSPIRT Foundation
Dr. Iswar Chandra Das
Scientist/Engineer “G” and Group Director, Geosciences Group, National Remote Sensing Centre, ISRO
Workshop 7 – Data for Urban Good: Perspectives on Data Science and MLOps
This session will cover two important aspects of using data for urban good:
State-of-the-art techniques used to extract meaning from the madness of data
Methods for architecting data processing systems to deal with large volumes
We will discuss various ML techniques that can be used to benefit people in the urban context. For these techniques we then describe the state of the art data processing architectures for an end-to-end MLOps pipeline that can accommodate a diverse variety of data use cases. By way of illustration, we explore three interesting application domains, namely, Air Quality, Solid Waste Management and Geospatial Satellite Image processing.
Workshop 6 – Healthcare Knowledge Graphs and Analytics
The workshop on Healthcare Knowledge Graphs and Analytics will explore how data modelling for healthcare, and NLP techniques can revolutionise healthcare by standardising data and analytics paving the way to building comprehensive knowledge graphs with ability for semantic reasoning and machine interpretable data and machine automatable algorithms. Participants will gain insights into the development and application of knowledge graphs in healthcare settings, focusing on real-world case studies and cutting-edge research.
Prof. Viraj Kumar
Vice-Chair of the ACM India Special Interest Group on Computer Science Education
Prof. Mitesh Khapra
Associate Professor, Indian Institute of Technology, Madras
Professor, Dept. Comp. & Data Sciences, IISc, Bangalore. Founder & CAiO, Zenteiq AiTech Innovations Private Limited.
Deepak
Invited Talks Session 3 – Research and Technology on AI and Data for Public Good
In this session, leading experts from academia and industry will present the latest research and applications of AI and data technologies for public good. The talks will showcase cutting-edge problems, innovative solutions, and ongoing advancements in areas such as healthcare, urban management, and societal well-being. The session aims to provide the audience with insights into emerging trends.
Panel Discussion 1 – Healthcare
This session will explore the role of public health data in driving actionable insights for policy and healthcare interventions. It will highlight the anticipated progress in collecting, analyzing, and utilizing data to address critical health issues, from disease surveillance to resource allocation. The discussion will also focus on the upcoming challenges related to data accessibility, quality, and privacy in public health systems, and strategies that will be developed to overcome these barriers. Attendees will gain insights into the future potential of data-driven public health initiatives.
Panel Discussion 2 – Urban Mobility
The panel discussion on “Roadblocks to Achieving Sustainable Mobility” will explore the critical challenges hindering the transition to sustainable transportation systems. Experts from various sectors will examine barriers such as inadequate infrastructure, policy gaps, technological limitations, and societal resistance. The discussion will also focus on innovative solutions and collaborative approaches needed to overcome these obstacles, ensuring a more sustainable and equitable mobility future for all.
Invited Talks Session 6 – Trends in Data Acquisition Technologies – focus on Sensors and Standards
This session will delve into the latest trends in sensor technologies and the evolving standards shaping data acquisition. With a focus on smart agriculture, smart cities, and geo-positioning applications, the discussion will highlight how emerging sensor technologies are transforming these sectors. Key challenges surrounding data management, including acquisition, storage, and distribution, will be addressed. Additionally, the session will explore the role of emerging standards in ensuring seamless data integration and interoperability across diverse platforms.
Invited Talks Session 2 – Data and Digitisation in Healthcare
This session explores the transformative impact of data and digital technologies on healthcare, focusing on how data-driven insights are enhancing patient outcomes, optimizing operational efficiencies, and supporting personalized medicine. Experts will discuss the role of AI, machine learning, and big data in diagnosing diseases, managing healthcare delivery, and advancing medical research. Attendees will gain a deeper understanding of how digitization is reshaping healthcare ecosystems and the challenges of integrating data privacy and security in a rapidly evolving digital landscape.
This presentation will focus on the application of GeoAI technologies in agriculture and how available data can be utilised to drive innovation and efficiency in farming practices. Emphasising the capabilities of Garudalytics’ smart mapping and AI solutions, we will explore how these tools enhance agricultural decision-making through advanced spatial analysis and predictive modelling. The discussion will include real-world examples where GeoAI has improved crop monitoring, yield prediction, resource management, and overall yield optimization. We will also address the practical challenges of integrating GeoAI into existing agricultural systems and offer strategies for maximising its benefits. Additionally, the talk will cover how GeoAI can leverage both structured and unstructured datasets to enhance agricultural outcomes, with a focus on Garudalytics’ Agri AI solution for integrating diverse datasets, including in-situ data.
Shekar Sivasubramanian
CEO, Wadhwani Institute for Artificial Intelligence
AI for Social Impact
We work in the social space, focusing on Applied AI. The space presents unique challenges and constructs that offer an excellent opportunity to have the best minds work through complex problems. The talk focuses on AI in this sector, using a case study-based approach and abstract principles that we present through our doing. This talk is a substrate of our experience in a “learn by doing” approach that we have found to be meaningful.
Manju Sarma
Dr Brahm Prakash Professor, NRSC/ISRO
Jaya Dhindaw
Executive Program Director, Sustainable Cities & Director, WRI India Ross Centers
Mahidhar Chellamani
Engineering Director, CDPG
Dr. Jyotirmoy Dutta
Principal Scientist & Program Manager, CDPG
Rakshit Ramesh
Engineering Director, CDPG
Swarup E
Technical Lead, Analytics Systems, CDPG
Hari Kumar
Director, Solvesustain
Pankaj Jalote
Pratima Joshi
Founder & Executive Director, Shelter Associates
Data Driven Development
“Accurate data is the lifeblood of good policies and decision making”
As nations and organisations strive to solve social problems around the world, the lack of accurate data has often been cited as a primary reason why policies do not translate into effective on-ground solutions. The reality in urban informal settlements is no different. They manifest multidimensional deprivation, characterised by a lack of secure tenure, inaccessibility, and inadequate sanitation and health services which marginalises the slum dwellers. Governments and NGOs also find it extremely difficult to effectively target vulnerable communities due to the lack of reliable data. Data on slum settlements is crucial for the inclusion of these underserved communities in city level development plans.
Realising the dire need for safe and hygienic sanitation facilities and practices, Pratima started leveraging data and technology since the late 90s when she realised that data with the Urban Local Bodies was inconclusive and disjointed with the on-ground reality. This propelled the need for a data system that would provide unfailing results. A year of continuous efforts and iterations resulted in a well-tailored Geographical Information System (GIS). It catered to the needs of slum mapping, and spatial layout formation. It also helped to link the socio-economic surveys taken to individual dwellings/house structures that were mapped on GIS. Our granular spatial data harnesses the power of geo-visualisation for effective planning and monitoring of our Sanitation, Housing and Covid-relief projects.
The communities form the backbone of Shelter Associates’ data-driven approach, as they are involved in conducting survey, creating awareness and making sure the data sets are inclusive. This spatial data is then shared with the respective Urban Local Bodies for validation. Once the process is complete, the data is made public on our website while it is also linked to the ULB’s website making it freely available for all to use.
The co-created data helps immensely in bridging the information gap. SA gives slum-dwellers a voice by arming them with data about their community, empowering them to make decisions making them partners in the developmental process.
Meera k
Founder & Trustee, Oorvani Foundation
Datajams for Public Problem Solving
OpenCity.in is a leading urban data platform that democratises city data across India by enhancing transparency, fostering understanding and facilitating civic engagement. Alongside hosting an urban open data repository, we work to build a strong open data community.
OpenCity collaborative events or “jams” enable citizens to participate in finding solutions to urban issues; they serve as an effective tool for public problem solving. These events bring together participants from diverse and multidisciplinary backgrounds to open up data, analyse it, and derive actionable insights. From water management to urban mobility, our crowdsourcing projects, datajams, hackathons, and solution jams, have become instrumental in breaking down data silos, revealing patterns, and constructing “what-if” scenarios to propose innovative solutions to pressing public issues.
Through these initiatives, OpenCity provides opportunities for the public to engage with urban issues, which can lead to actionable insights and potential solutions. Our approach brings the power of collective intelligence to drive civic action for better cities.
Panel Chair
Prof. Vijay Kovvali
Research Professor, CiSTUP, IISc
K. V. S. Hari
Director, Centre for Brain Research, IISc, Bangalore
Challenges Faced with Longitudinal Studies in Healthcare’
The talk will present details of two longitudinal cohort studies in the context of ageing brain research. One study is in the urban area and the other in a rural area. The challenges of sustaining a large cohort of several thousand participants over several years along with the handling of large data that is generated from such studies will be presented.
Workshop 2 – Harnessing the Power of Remote Sensing Data
The workshop on Harnessing the Power of Remote Sensing Data will delve into the transformative potential of remote sensing technologies in various sectors, including environmental monitoring, urban planning, and disaster management. Participants will explore techniques for data acquisition, processing, and analysis, gaining hands-on experience with tools that enable precise, large-scale observations of the Earth’s surface. This session will provide valuable insights into how remote sensing data can be effectively utilised to drive informed decision-making and innovation.
Workshop 5 – Geospatial Data Processing on the Geospatial Data Exchange (GSX) Platform
This workshop will introduce participants to a pivotal geospatial data exchange platform that supports the National Geospatial Policy (NGP 2022). Attendees will explore the platform’s capabilities, including data exploration, user-consumer interactions, and analytics. This hands-on session is essential for anyone involved in geospatial data, offering practical insights into how to build innovative applications using the geospatial data exchange.
Workshop 3 – Demos on Secure Data Handling Using Privacy Enhancing Technologies
The workshop on Demos on Secure Data Handling Using Privacy Enhancing Technologies will showcase practical demonstrations of cutting-edge privacy-enhancing technologies, including Differential Privacy, Trusted Execution Environments (TEEs) and Secure Multiparty Computation (SMPC). Participants will gain practical insights into how these technologies can be integrated into industry solutions and government systems, enabling secure collaboration and innovation while adhering to regulatory requirements. This session is ideal for those looking to explore new applications in the area of secure computing and privacy-preserving data analysis.
Workshop 4 – Young Researchers’s Forum on Data and AI for Public Good
The Young Researchers’ Forum on Data and AI for Public Good will feature engaging poster sessions from early-career researchers, including Postdocs, PhD students, and Master’s by Research candidates. This symposium provides a platform for emerging scholars to showcase their innovative research on leveraging data and AI to address public good challenges, fostering discussions and networking opportunities with peers and experts in the field.
Workshop 6 – Data for Urban Good: IUDX Dashboards and Sandboxes
The IUDX Dashboards and Sandboxes workshop will highlight the transformative potential of the India Urban Data Exchange platform, deployed in over 50 cities across India. This session will demonstrate how IUDX can be leveraged to create data-driven dashboards for city governance, focusing on impactful use cases in traffic management, solid waste management, and green corridor management, integrating data analytics and geospatial technologies.
Workshop 1 – Education and Training for Responsible AI
The Education and Training for Responsible AI will have leading educators and practitioners from industry and academia to examine how teaching and training occurs in this fast moving space, and how flexible, life-long learning is inculcated in alignment with the National Education Policy (NEP). This will cover both degree-based training universities, certifications through edtech companies, and internal training imparted by the learning teams within companies. The unique needs of training on data and AI for public good will be explored.
Akhilesh Srivastava
Road Safety Ambassador, International Road Federation Advisor, Project India Road Safety 2.0, WEF
Dayanidhi D
Director, Engineering & Growth, Namma Yatri
Anoop Bhatt
Executive Officer, Head Powertrain & xEV Engineering Maruti Suzuki India Limited
Rahul Pandey
Sr. Operations Officer, World Bank Health Systems
Rukmini S
Founder & Director, Data For India
Rajeev Sadanandan
CEO, Health System Transformation Platform
Session Chair
Pankaj Mishra
Deputy Surveyor General, NIGST, SOI, Hyderabad
Dr. Prasanta Ghosh
Associate Professor, IISc
Capturing the Spoken Language Landscape of India for an Inclusive Digital India
Digital interfaces and communications have become critical for access to information, entertainment, economic opportunities and even essential services such as healthcare. Speech is the most natural form of communication, and most Indians are not digital natives comfortable with typing or English. We need spoken language interfaces that work for all variations and dialects. But such data barely exists. IISc-ARTPARK’s umbrella of open-source speech data initiatives are capturing the true diversity of India’s spoken languages to propel language AI technologies and content for an inclusive digital India, in collaboration with Bhashini, MEITY.
Abhilash Soudararajan
TBD
TBD
TBD
Raghu Dharmaraju
CEO, ARTPARK, IISc
MIDAS India: Building a National System for High-Quality Data in Health – Why, What, How
High-quality data is the key to realizing the promise of AI in healthcare. ICMR (Indian Council of Medical Research), IISc and ARTPARK are building MIDAS India, a national system for gold standard datasets to enable research, validation and deployment of AI-based solutions. It is a DPI (digital public infrastructure)-enabled, thematic hubs-and-spokes system through which purpose-appropriate datasets that reflect the diversity of India’s population, settings and needs can be collected, curated and made available. The effort has been kicked off in collaboration with AIIMS New Delhi and several other institutions across the country, starting with Oral Cancer screening.
Geospatial Data Applications – The Perspectives from Practitioners
The invited talks session on Geospatial Data Applications: Perspectives from Practitioners will offer insights from industry experts on the practical applications of geospatial data in various sectors. Attendees will gain a deeper understanding of how geospatial technologies are being leveraged for real-world problem-solving, from urban planning to environmental management. In addition, the practitioners will speak on the challenges they speak and how a geospatial data exchange can help in accessing the data and shorten the product development cycle.
Invited Talk Session 4 – Data for Public Good: Best Practices and Lessons Learned
It is well established that if properly harnessed, data has the power to transform societies. However, in practice, the pathway to achieving societal impact is not so straightforward. This session focuses on the challenges that are typically faced in the journey of utilising data to realise positive change. There will be talks by experts who have a long experience in this field, and they will describe some of the best practices and the lessons learned.
Invited Talks Session 1 – Data Collection and Privacy
Data collection is the first step and is also one of the hardest challenges in realising the potential of data for public good. Often, the required data is not easily available, it is incomplete or erroneous, the formats are not standardised, and the sources are disparate. In many cases, some special tools need to be developed for the purpose of data collection, especially in situations where connectivity is poor. In addition, issues related to data privacy, security, and governance need to be addressed before the data can be shared for building useful applications. This session will focus on some recent large data collection efforts and address some of the privacy governance issues.
Rajesh Gupta
General Manager, Strategic Accounts, Invas Technologies (P) Ltd.
SmartKheti – Improving Farm Productivity and Life of Farmers
SMARTKHETI is a One M2M based integrated platform designed to revolutionise modern farming by providing farmers with comprehensive tools for automation, real-time visibility, and market access. This proposal outlines a cutting-edge system that combines Internet of Things (IoT) technology with web-based applications to offer farmers advanced capabilities, including farm automation, real-time crop monitoring, weather updates, government alerts, market pricing, and equipment rental services. Smart Kheti is certified by ICAR, Delhi
Dr. Aniruddha Roy
CTO, Genesys International Corporation Ltd
Genesys Content Program: Transforming Cities into Digital Twins through Technological Innovation
The advent of 3D urban spatial Digital Twins marks a significant milestone in the management of modern cities. This presentation will delve into the transformative potential of these technologies, particularly in the context of India’s National Geospatial Policy 2022. By exploring how Genesys’ content program is spearheading the creation of detailed, city-centric datasets, the talk will highlight the practical applications of these Digital Twins. These datasets not only enhance urban planning and infrastructure management but also foster a new paradigm in how cities are monitored, maintained and developed. Attendees will gain insights into the critical role geospatial data plays in shaping smarter, more resilient urban environments for the future.
Dr. Abhay Sharma
CTO, CDPG
Incorporating Privacy Enhancing Technologies in Computation and Exchange of Sensitive Data
As organisations increasingly rely on data-driven insights to fuel innovation, collaboration and decision-making, the need to process sensitive data, such as data containing PII, confidential business information etc., securely has become more critical than ever. Further, the organisations are increasingly tasked with balancing the utility of data with the need to protect individual privacy. Traditional methods of data protection and data anonymization often fall short, especially when computations are performed on datasets containing sensitive information. Privacy Enhancing Technologies (PETs) offer a transformative technological approach, enabling secure computation and further, enabling balancing privacy and utility while working with the underlying data.
This talk will explore the integration of PETs into computational processes involving sensitive and private data, and securing data in its different states: at rest, in transit, in-use and post-use. We will discuss the role of foundational PETs such as Confidential computation with hardware based Secure Enclaves, secure multi-party computation, homomorphic encryption, and federated learning, examining how these technologies protect data across its lifecycle, ensuring that sensitive information remains secure whether it is stored, transmitted, actively processed or released after undergoing some aggregation transformation. We will also discuss implementation, performance and deployment issues concerning PETs. We will present different use cases where secure computation is paramount and PETs become a key enabler. Overall the talk will provide a good overview on how PETs can be effectively incorporated into computational workflows to enhance data privacy across all stages and provide some actionable insights on leveraging PETs to securely manage and compute sensitive data in your organization.
Usha
TBD
TBD
TBD
Workshop 9 – Hackathon Finale
The Hackathon Finale will bring together the brightest minds who have been competing to develop cutting-edge solutions for the urban mobility problem in Bengaluru. During this session, the top teams will present their innovative projects, demonstrating how they’ve created solutions to given problem statements of the hackathon. Judges will evaluate the solutions based on the accuracy of the results, novelty, and feasibility, leading to the announcement of the winning teams. Join us for an inspiring showcase of innovation and a glimpse into the future of tech-driven problem-solving.
Abhijeet Sinha
Program Director – Ease of Doing Business, Project Director- NHEV, President – CPOS India, Director DIISHA
Panel Discussion – Roadblocks to Achieving Sustainable Mobility
The panel discussion on “Roadblocks to Achieving Sustainable Mobility” will explore the critical challenges hindering the transition to sustainable transportation systems. Experts from various sectors will examine barriers such as inadequate infrastructure, policy gaps, technological limitations, and societal resistance. The discussion will also focus on innovative solutions and collaborative approaches needed to overcome these obstacles, ensuring a more sustainable and equitable mobility future for all.


