


India’s energy sector is significantly propelled by its robust indigenous wind power industry, which has demonstrated consistent and notable growth over time. Wind energy accounts for approximately 35% of the total renewable energy1 in the country. As of 2020, India ranked 4th in wind power and 5th in solar power globally2. Looking ahead, India has set an ambitious goal to install 500 GW of renewable energy capacity by 2030 , with wind energy playing a pivotal role in this endeavour, essential for reducing the nation’s carbon footprint3.
Harnessing wind power, a clean and renewable energy source, enables India to decrease its reliance on fossil fuels for electricity production, thereby reducing pollution and combating climate change. By cutting down on emissions, India can contribute to global efforts to mitigate global warming. Diversifying energy sources also enhances energy security by reducing dependence on foreign oil and gas. Furthermore, wind energy projects generate jobs and investment, fostering community development and sustainability.
According to the Global Wind Report (2024)4, based on the ~10% growth rate of wind power generation in India over the past decade, there is a projected 74 GW gap to achieve the target of 140 GW by 2030 . Substantially increasing the number of wind farms is crucial for meeting this target, significantly advancing India’s efforts to reduce carbon emissions and combat climate change.
SIRPI, an expert in the wind energy sector, has been working closely with UGI to develop an easy to use web application re:Wind that allows exploration of historical wind data by combining it with UGI’s geospatial datasets:
- Find out on a click, the wind speed at a particular geo location in India,
- Design parameters using well established and understood empirical formula,
- Wind regime in India is influenced to a large extent by the strong south-westerly monsoon, starting in May-Jun. It has been generally observed that 60%-70% of the total wind power generation in the country takes place during Apr-Sep when the south-west monsoon is active throughout the country. The above patterns are clearly visible in the web app visualisations,
- Additionally, the top 10 states with the greatest wind potential and the largest wind farms are shown on the map.
- It is also possible to calculate the wind energy output based on the wind speed at a specific location.
Copernicus is the earth observation component of EUs space program. The objective of Copernicus is to use vast amounts of global data from satellites, ground-based, airborne and seaborne measurement systems. Copernicus platform has mean wind speed data measured at a height of 10m. re:Wind overlays mean wind speed data on top of state boundaries of India provided by the Survey of India (SOI) to build the application. UGI provides users the access to different data layers in a standardised and secure manner.
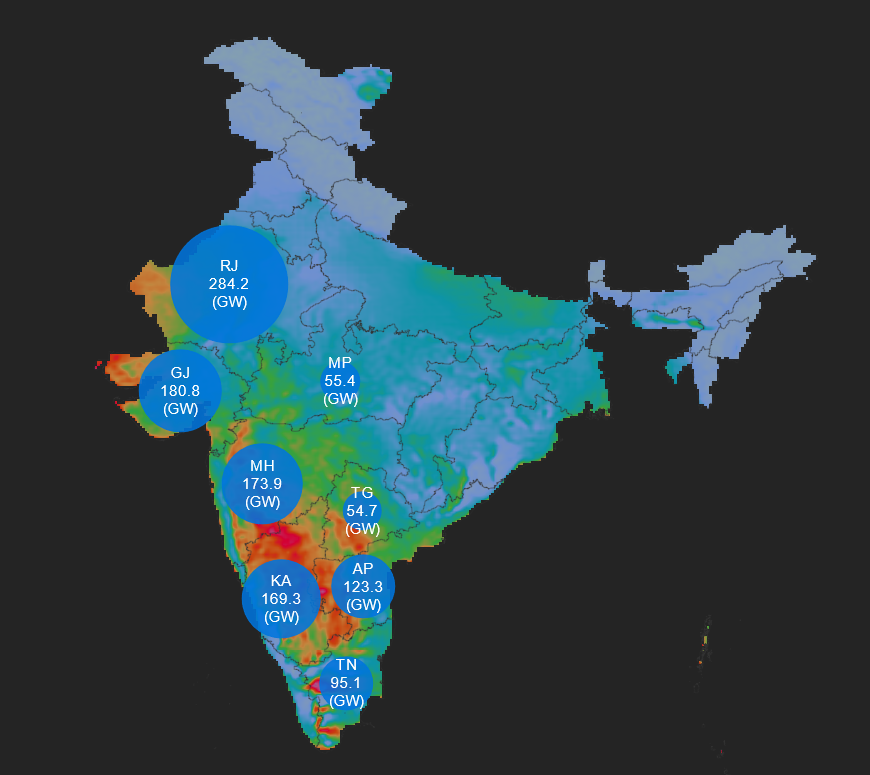
Fig 1: This figure illustrates estimated wind power across the top 10 states in the country with the highest wind potential
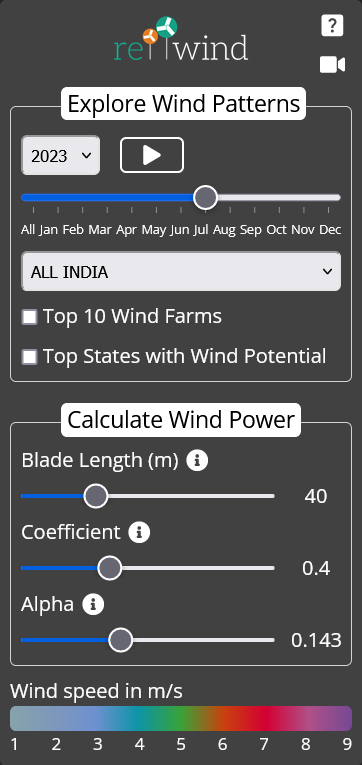
Fig 2: This figure illustrates application user interface to compute wind energy based on given parameters.The minimum and maximum values were used to generate a color graded output with purple denoting the highest and blue the lowest wind speeds respectively (see legend)
Sirpi has significant expertise in the wind energy sector having developed a data driven software analytics platform to help Wind Pioneers, a UK based wind consultancy.
Users are welcome to explore this tool by using the link https://rewind.sirpi.co.in/
Based on these above listed and other insights, interesting observations regarding the mapping of these data and the ability to understand and interpret wind data, helps in optimising the placement of wind turbines, predict energy output and maximise efficiency. By fostering an environment conducive to wind power development and adoption, we can accelerate the transition towards a more sustainable energy paradigm.
References
- https://gwec.net/india-wind-energy-market-outlook-2023-2027-report/#:~:text=By%20the%20end%20of%202022,terms%20of%20cumulative%20installed%20capacity.
- https://saspartners.com/wind-energy-in-india-an-overview/
- https://www.narendramodi.in/what-is-india-doing-towards-renewable-power-generation-579496
- https://gwec.net/accelerating-onshore-wind-capacity-additions-in-india-to-achieve-the-2030-target/, https://gwec.net/global-wind-report-2024/
Related Posts


