




Authors: Linda Theres B, Jyotirmoy Dutta, Rakshit Ramesh
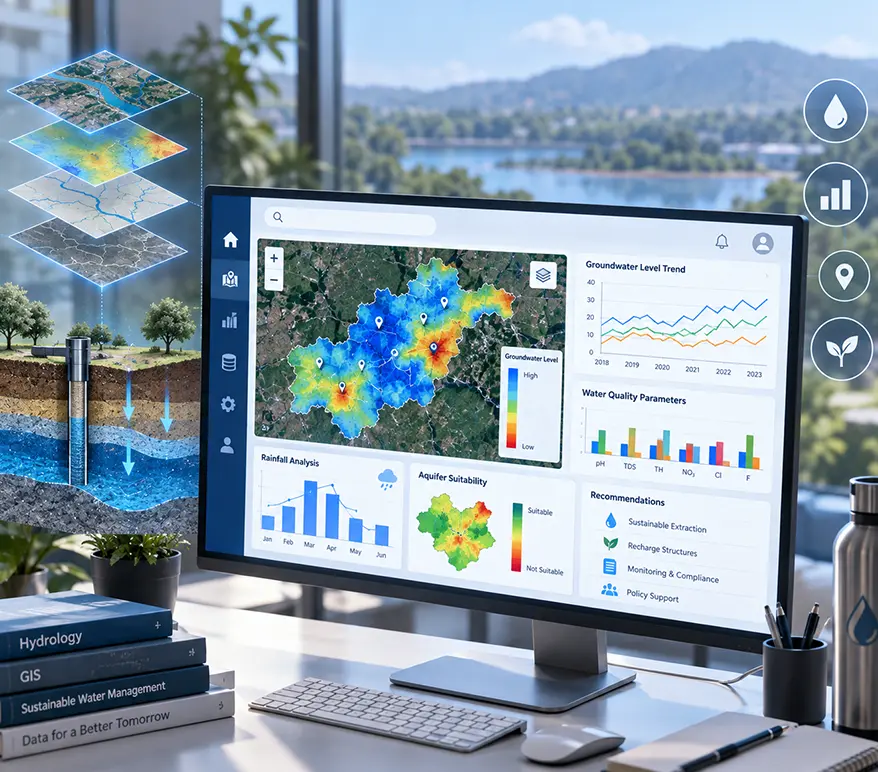
Water quality monitoring is crucial for ensuring public health and sustainable resource management. Traditional methods often lack integrated tools for analysis, visualization, and reporting, leading to fragmented insights. To address this gap, an interactive dashboard has been developed to streamline water quality data assessment and visualization. The dashboard enables users to upload datasets, perform data exploration with statistical summaries, and conduct water chemistry analysis through Piper plots and bar charts of six key parameters. Filtering options allow data selection by state, district, and block, while users can identify water chemistry types and receive suggestive measures. The system computes the Water Quality Index (WQI) to classify water suitability for human consumption, with results visualized via bar charts and box plots. Automated PDF report generation supports efficient dissemination of insights. By unifying data management, advanced analysis, and reporting, the dashboard provides a comprehensive tool for researchers, policymakers, and water resource managers working in water quality assessment.